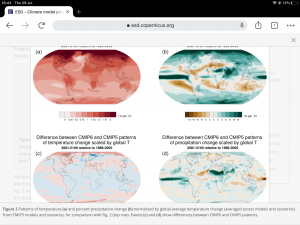
Figure 2(a, b) Patterns of temperature (a) and percent precipitation change (b) normalized by global average temperature change (averaged across CMIP6 models and all Tier 1 plus SSP1-1.9 scenarios). (c, d) Standard deviation of normalized patterns for individual CMIP6 models and scenarios. The individual patterns are the elements from which the averages shown in the top row are computed. (e, f) Standard deviation of normalized patterns, after averaging across scenarios, highlighting the role of intermodel variability. (g, h) Standard deviation of normalized patterns after averaging across models, highlighting the role of interscenario variability
